
VEHICLE USAGE THROUGH THE PANDEMIC
In this article, ACA Research takes a look at how vehicle usage has changed in the last two years
Vehicle usage used to be incredibly consistent. While there were changes, they tended to happen over extended periods of time.
This was disrupted through 2020 and 2021, with many vehicles sitting idle for long periods. That created issues for any business working on the basis of distance travelled (for example, servicing, insurance, finance, and so on), forcing them to review all their underlying assumptions and processes.
To what extent did usage really decline though? Looking at data from the ABS, we can see that the average distance any individual vehicle travelled in 2020 dropped by around 10 percent (13,617km to 12,085km).
While that’s quite significant, the flipside is that some vehicles were doing large mileage through the heart of the pandemic. In fact, Australian vehicles travelled almost 240m kilometres in 2020.
To get to the full story, we therefore needed to go deeper. We had a look at how average distances travelled by each type of vehicle changed versus 2016, finding that while passenger vehicles were sitting at home, usage of utes and vans remained slightly higher (given industries like construction were in many cases exempt from movement restrictions).
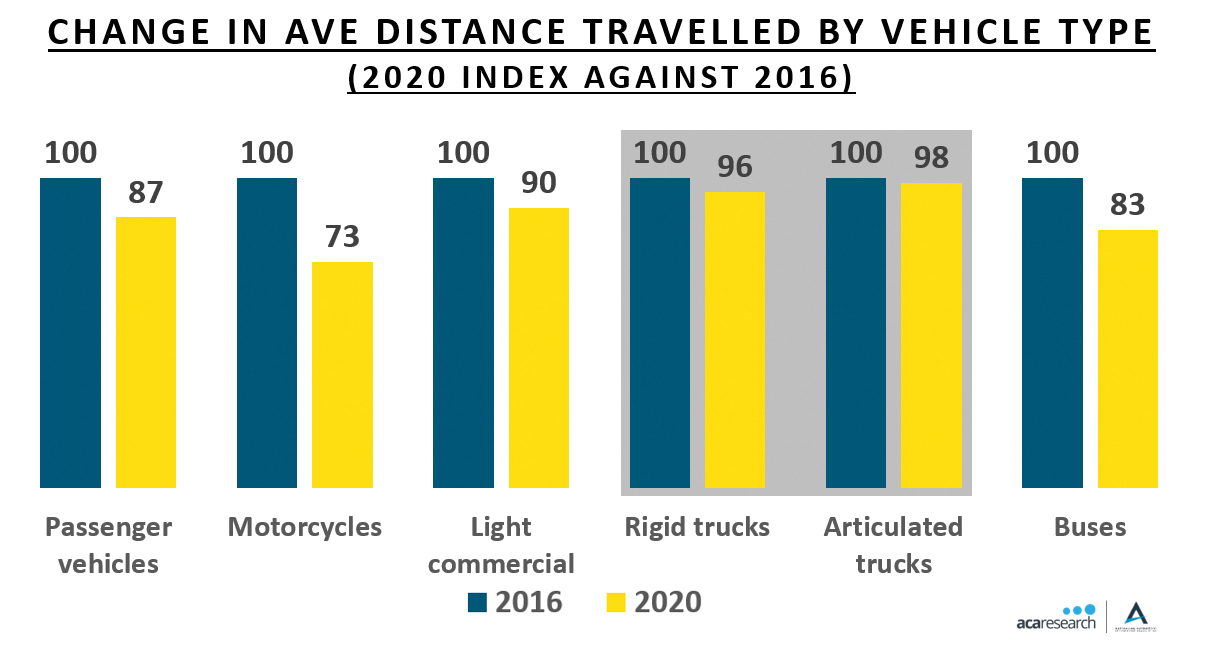
Bus usage also significantly fell off the back of the reduced movement of people. This was however clearly not the case for heavier commercial vehicles, with trucks travelling largely similar distances in 2020 as in 2016.
That isn’t however to say that passenger and light commercial vehicles weren’t being used in some places.
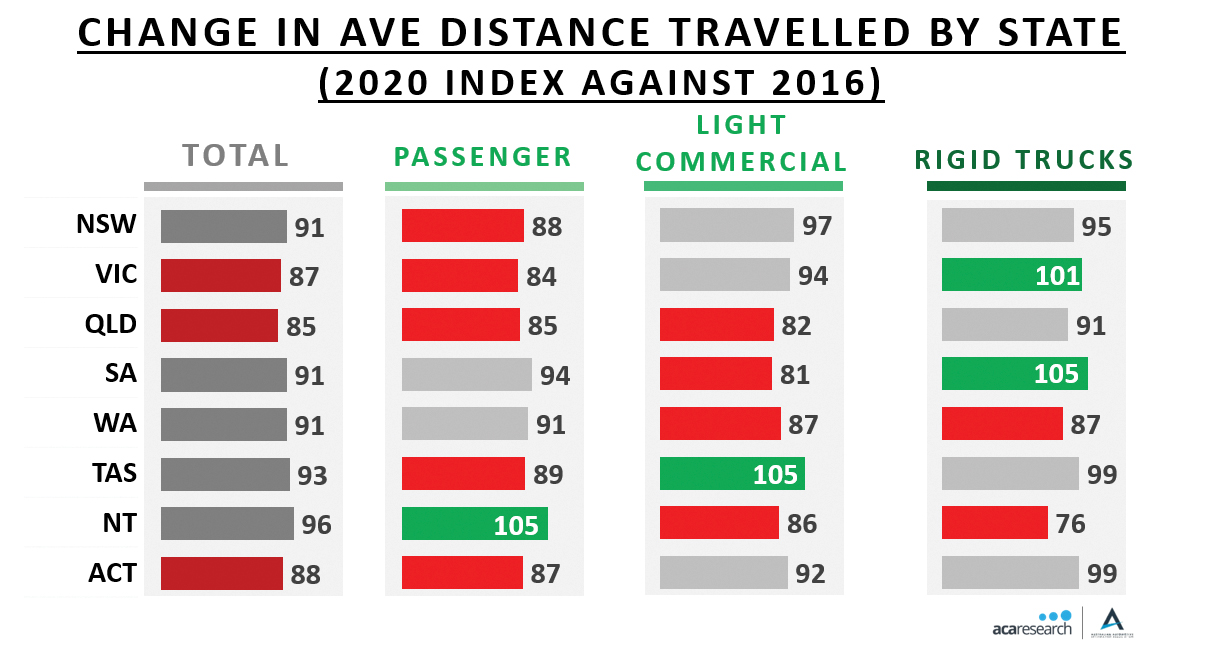
In fact, looking at usage by state, it is much more variable than might be assumed. It is no surprise that passenger vehicle usage was well down in most states and territories, but this was less pronounced in Western Australia and South Australia.
Also, light commercial vehicles in the key lockdown states of NSW and Victoria were on the road significantly more than their counterparts in Queensland, South Australia, or Western Australia.
Alongside this, despite restrictions in Victoria, truck traffic through the state was actually higher than recorded in 2016 – one can assume a by-product of vast increases to last mile delivery services.
Ultimately, this again reminds us of the importance of digging deeper into statistics such as these. While the national numbers are interesting, they hide the nuance in the data.
A business in Victoria supporting commercial vehicles can tell a much more positive story than one in Queensland, despite the vastly different experiences in those states during the pandemic.
As a reminder here, a key resource that is available to help AAAA members understand their local environment is the car parc data.
This digital platform provides insights around the car parc, households and businesses down to an LGA level. This tool is also in line for a significant upgrade in 2022 – watch this space.
This column was prepared for AAAA Magazine by ACA Research, the AAAA’s partners in the AAAA Aftermarket Dashboard which is delivered to AAAA members each quarter.
For more information, visit www.acaresearch.com.au or contact Ben Selwyn on bselwyn@acaresearch.com.au